Research, design & making · 6 pages · Select “View at 100%” to read the finer details.
06
The garden that stays
A rain-and-soil teaching model for four-year-olds in Auckland
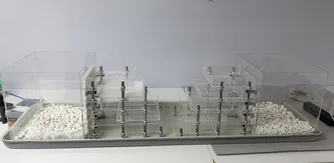
January 2023 was Auckland’s wettest month on record, with 280 mm of rain in less than a day. Where the ground has been dug, flattened and pressed, that water cannot get down: it waits around the roots. The Garden That Stays lets four-year-olds watch one shower travel through a whole soil profile, from the surface to the cup underneath. Side A has one pressed layer and side B does not; red dye shows what water carries, and three sensors tell the teacher how wet each layer is. Built from laser-cut 4 mm acrylic and 3D-printed parts. The research, interaction design, modelling and build are mine.
Rain pipesmall holes along a silicone tube; a pump lifts water from a bucket
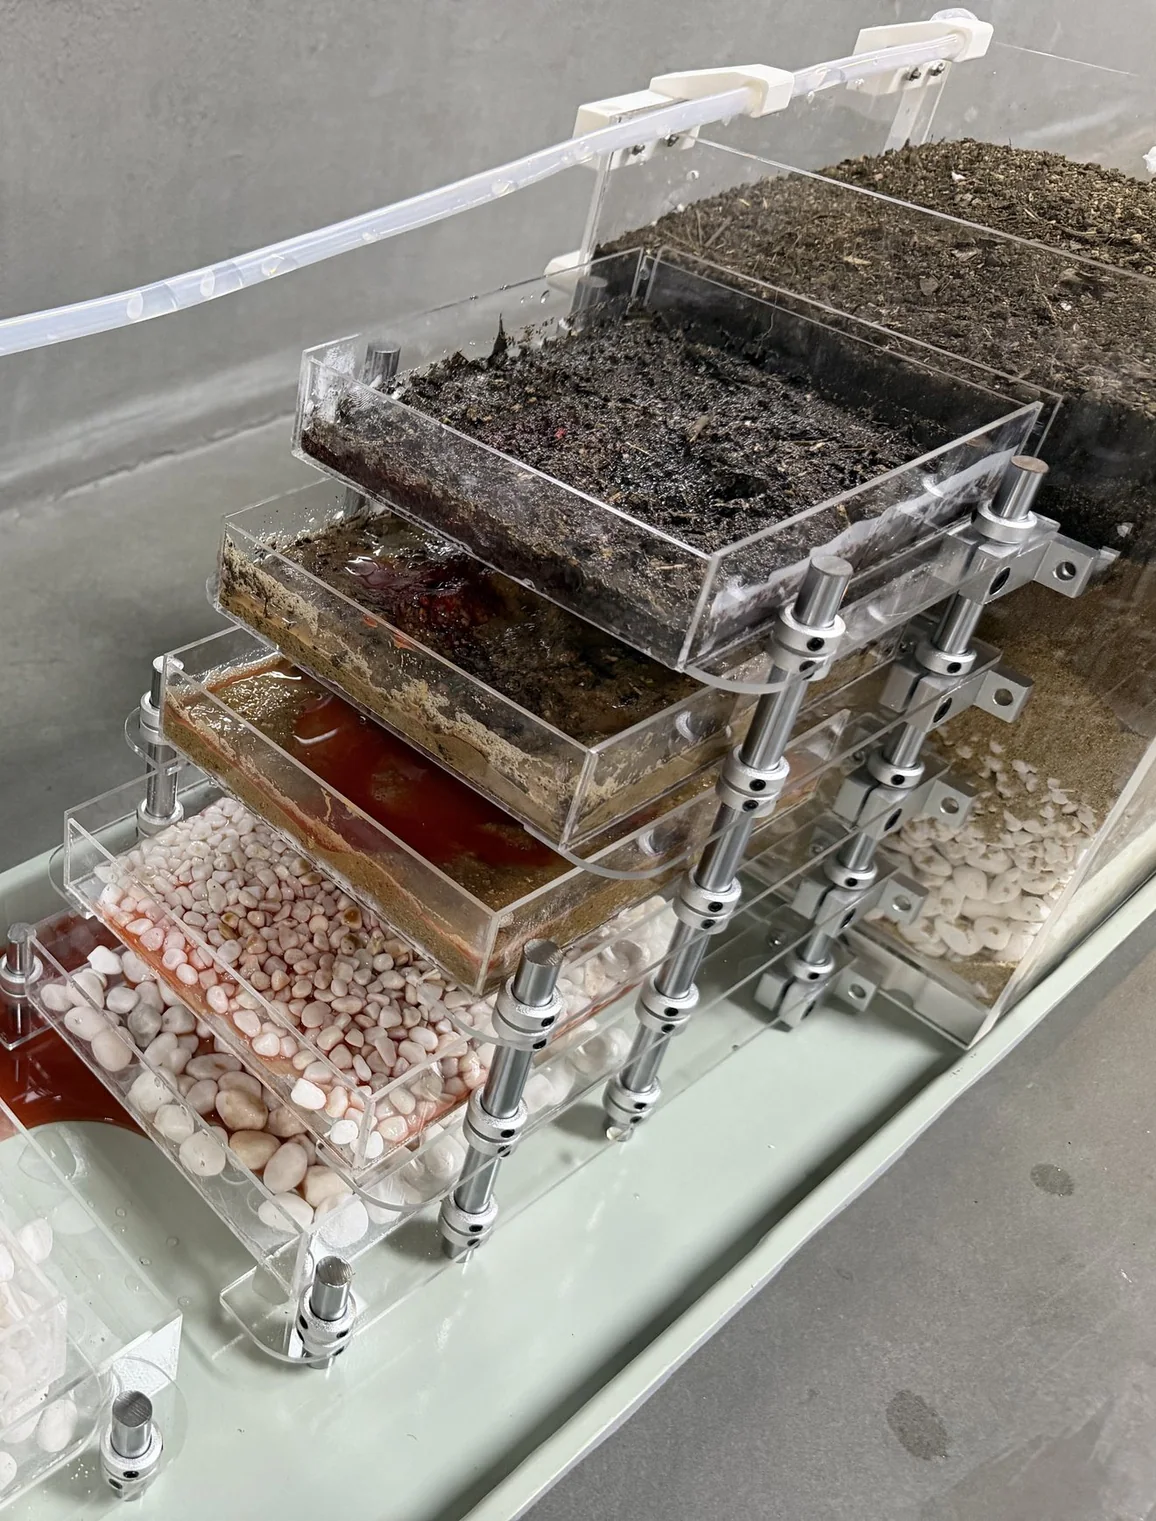
Red tracerfood dye follows the water from tray to tray, down to the spill tray
Side B · five trays in series
02 Research · rain, soil, roots
The rain came faster than the ground could take it.
January 2023 was Auckland’s wettest month on record. How much rain falls matters less than where it can go: earthworks, rollers and paving close the soil’s pores, and new turf on top does not open them again. Water then waits above the hard layer, roots run short of air, and what the soil was holding starts to move. The model had to show that chain, and claim no more than the evidence does.
AThe storm in numbersNIWA, Albert Park gauge, central Auckland [1]
BWhy the water staysa section through a built-over garden, not to scale
What the water does
1Runs off. Paving and pressed ground send rain sideways. In two Auckland catchments, new lawns mapped as permeable behaved more like paving in big storms [2][3].
2Waits. It stops above the hard layer and spreads sideways: a perched, temporary water table.
3Drowns the roots. Roots and microbes use oxygen that saturated soil cannot resupply; roots fail, and Phytophthora can spread in the soil water [4][5].
Where nutrients go · and what it does not prove
aLeaching – dissolved nitrate moves down with water that gets through. More ponding is not more leaching.
bRunoff, erosion – water carries soil and what sticks to it. Muddier is not richer.
cDenitrification – without oxygen, microbes turn nitrate into gas. Not all nitrogen goes.
dUptake blocked – hurt roots cannot take up what is there. Yellow leaves do not prove poor soil [4][6].
CWhat I let myself claimevery number graded before it went into the model
Claim
Where it comes from
Used as
539 mm in January 2023; 280 mm in under 24 hours
NIWA, read in full [1]
Fact
Compacted new lawns can act like paving in a big storm
study summary, two Auckland catchments [3]
Fact
Roots in saturated soil run out of oxygen; rot can follow
general plant science [4][5]
Mechanism
About 80 % of flood sediment came from banks and slips
one Hoteo flood only [7]
Not for gardens
Soil storage falls from about 200 to 50 mm
conference slide, metric undefined
Not used
Roots stay in the top 20–30 cm; damage starts below 20 cm
no sample, no source to check
Not used
Keep coffee grounds under 20 %
a compost-heap rule, not a soil mix [8]
Not used
The model therefore shows a mechanism, not a measured Auckland site: no rot rate, no nutrient loss in kilograms, no share of the flood blamed on any one cause.
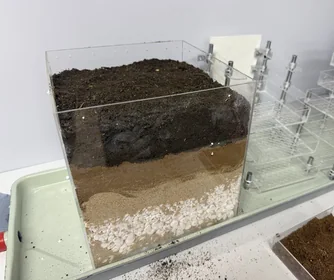
FIG. 02The model’s profile – humus, soil, sand, gravel, each about 5 cm – is a teaching assumption. It is labelled that way until a documented Auckland profile replaces it.
[1] NIWA 2023, Auckland suffers wettest month in history [2] NIWA, Stormwater: an introduction [3] S. Ira, Univ. of Auckland 2025, Save our soils [4] RHS, Waterlogging and flooding [5] RHS, Phytophthora root rot [6] Fernandez & Kaiser, Univ. of Minnesota 2021, Understanding nitrogen in soils [7] NIWA 2019, Sediment fingerprinting [8] K. Pokorny, Oregon State Univ. 2023, Coffee grounds
03 Concept · where the rain goes
Where did the rain go? And where did it stop?
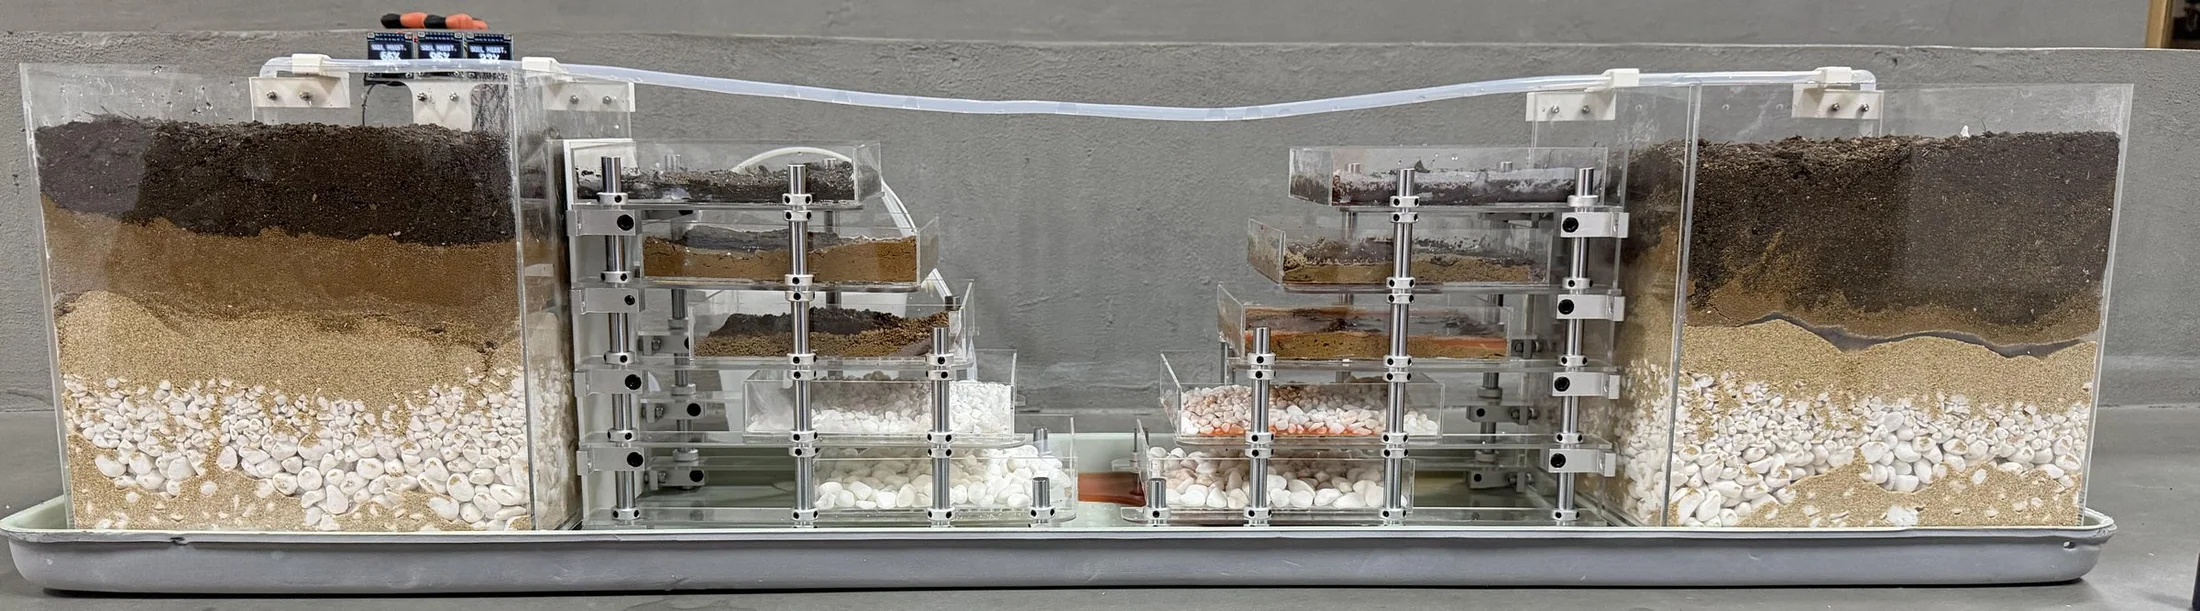
The model asks a four-year-old one question at a time. Its two sides are built the same way from the same materials and differ in one thing only: on side A the second layer is pressed hard. A pump rains on both through one pipe. Children watch with their eyes, not with numbers; the numbers are for the teacher.
Asecond layer pressed
Bsecond layer loose
1
2
3
4
5
6
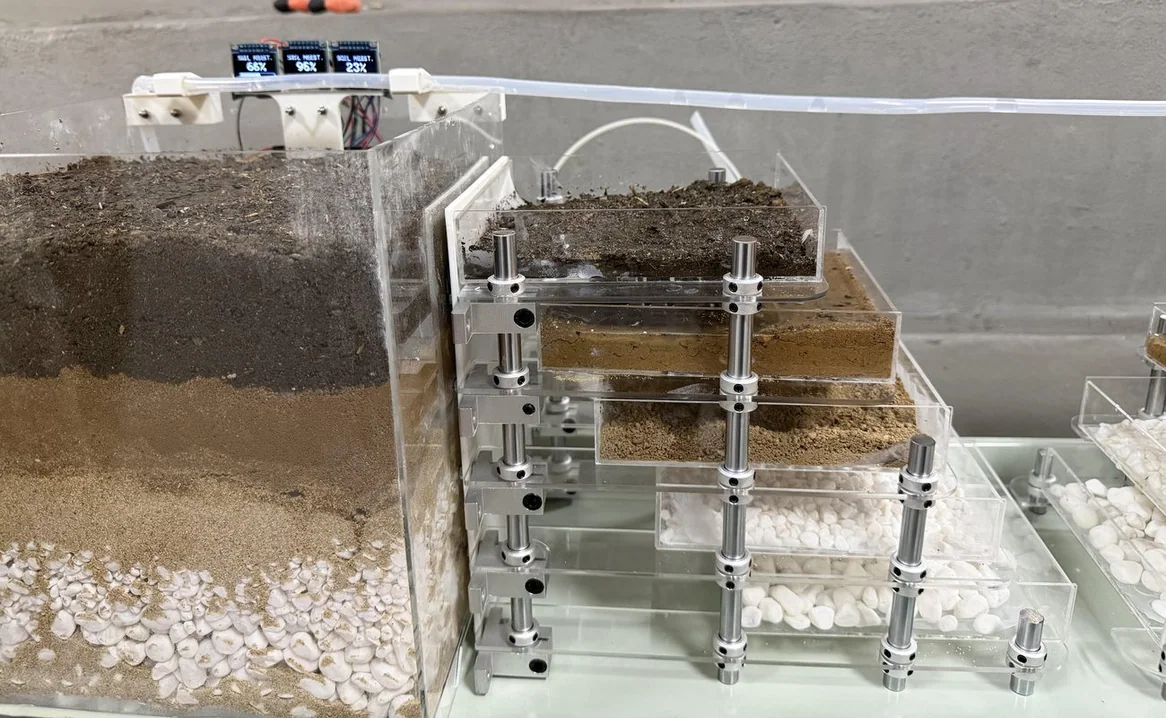
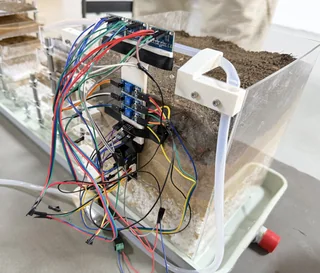
1Sensors. Three probes in box A; the screens read 66, 96 and 23 % for layers 1–3.
2Rain pipe. Holes along a silicone tube; a small pump lifts water from a bucket.
3Tower A. The second layer is tamped hard; the water stops on top of it.
4Tower B. The same five layers, loose; red dye follows the water down.
5Profile boxes. Humus, soil, sand, gravel, about 5 cm each, behind clear walls.
6Spill tray. Whatever drains out is caught, so A and B can be compared.
ATwo sides, one differencewhat each side did, as a schematic
BOne shower, six momentsa teacher with four children, one question at a time
CWho does whatthe research stays with the adults; the watching is the children’s
Children · age 4
Watch where the soil turns darker, where water shines and where it comes out. Guess, then say how A and B are different.
Teacher
Pours the same rain on both sides, explains what the model can and cannot show, and never promises a puddle.
Designer
Chooses materials from a real profile; checks outlets, interfaces and pressing before blaming the soil.
04 Structure · making
4 mm acrylic, cut and clamped. Every layer stays in view.
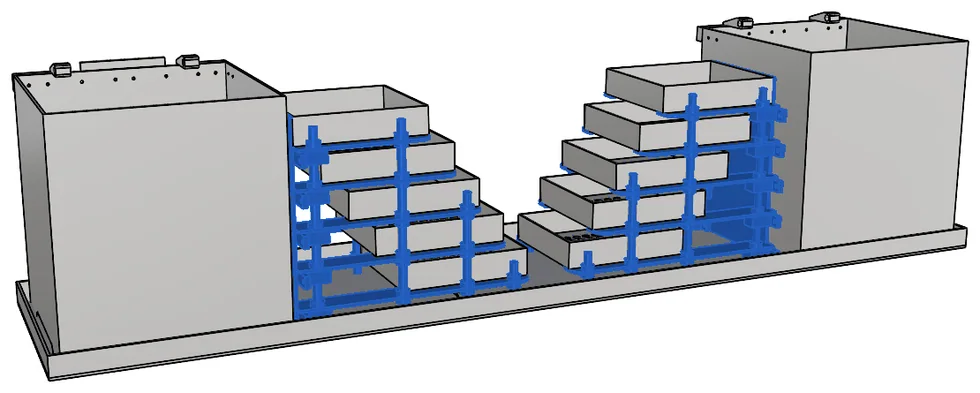
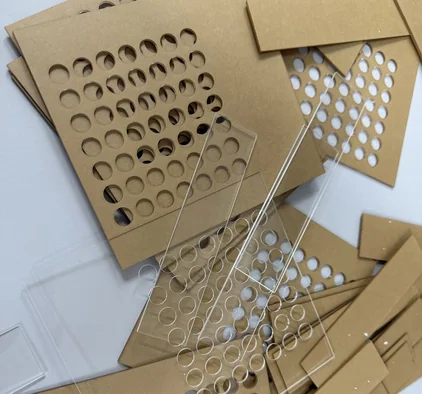
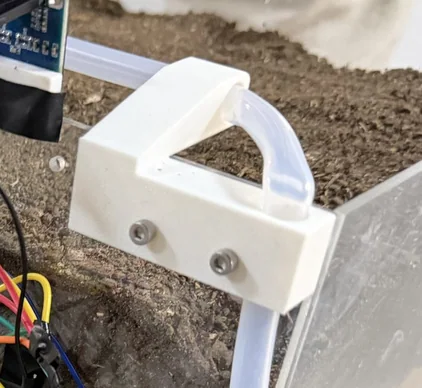
Everything the children look through is clear 4 mm acrylic, laser-cut from the CAD model: box walls, tray walls, perforated floors and the arms that carry each tray. Joints that would need several glued pieces – pipe clips, the screen mount, tube guides – are 3D-printed. Standard aluminium rods, shaft supports and collars hold the towers, so any tray can be lifted out, refilled and clamped back at the same height.
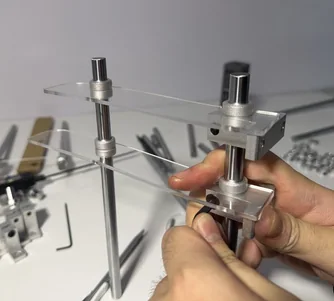
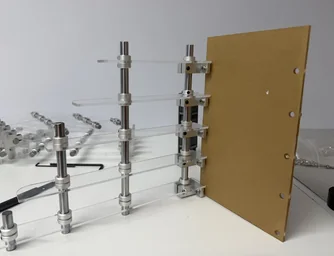
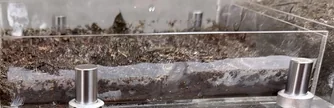
FIG. 03 one tower before filling: five tiers of arms, collars and shaft supports
FIG. 04CAD model. Blue: the laser-cut frame – arms and back panels – with rods and supports. Grey: profile boxes, trays and the spill tray.
AThree ways of makingchosen by what each part has to do
Laser-cut acrylic · 4 mm
Box and tray walls, the perforated floors, tray arms in five lengths, back panels. Cut from the CAD outlines; the paper film stays on until assembly.
3D-printed
Pipe clips screwed to the box tops, the screen and sensor mount, tube guides: shapes that would take several glued acrylic pieces.
Standard parts
Aluminium rods, shaft supports and collars, the spill tray, a small pump and silicone tube. Bought, not made, so the towers can be re-clamped.
BHow a tray is heldside view, not to scale
CAssembly, in six stepsfrom flat parts to a filled profile
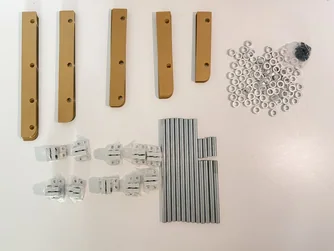
01Parts out: arms in five lengths, rods, supports, collars.
02Each arm is clamped between two collars on its rod.
03Supports go on the back panel, five levels high.
04Both towers stand in the spill tray; gravel goes in first.
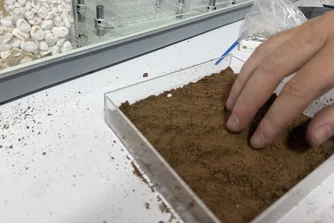
05Trays are filled and levelled; on side A the second layer is tamped.
06The profile boxes are filled layer by layer, about 5 cm each.
05 Interface · signals, screens, cards
Wet is not water. Red is not plant food.
A four-year-old reads the model by colour, by a shining line and by the cups, so each signal was given one meaning and one word. The screens, the stickers and the teacher’s script never call a darker band water, never call the red trickle plant food, and never promise a puddle that did not happen.
Screens · 66 / 96 / 23 %layers 1, 2, 3 of box A, on a 3D-printed mount
AFour signals, kept apartwhat a child sees, and the one thing it means
You see
It means
It does not mean
A darker band
the soil there is wetter
not a water level
A shining line
water is standing there
mark it only when you can see it
Water in a cup
water that left the box: top cup ran off, bottom cup drained
pour minus catch is not water plants can use
Red moving down
something dissolved moves with the water
not plant food; dye can stick to soil
BMoisture by layerbox A
CThe screensas built, and proposed
DBehind the screensone loop for water, one for sensing
“Darker means wetter. Shining means water.”
The two sentences every adult on the team says the same way, at the model and on the card.
The back of box A: three boards, the controller and the screens’ wiring.
EThe child’s cardfront for the child, back for the teacher · proposed
Asecond layer pressed
Bloose · red tracer added
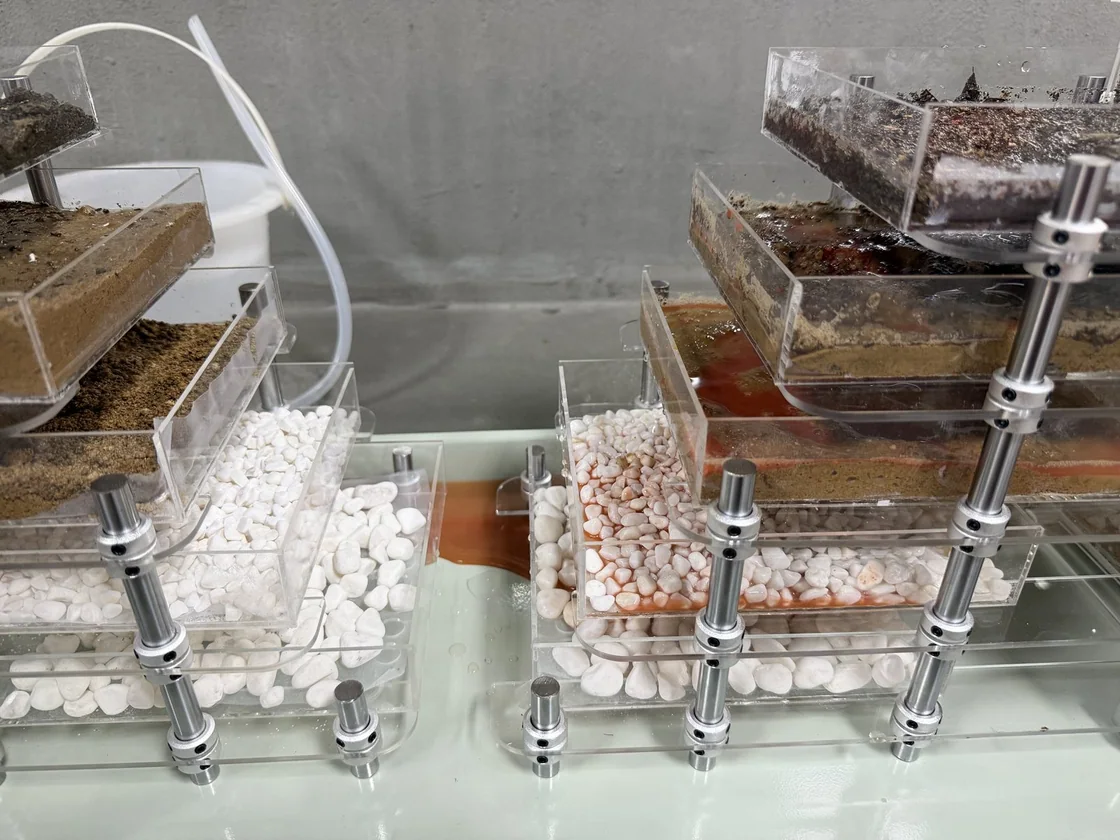
FIG. 05After one run. On B the tracer reached every tray and spread across the spill tray; tower A is shown without dye.
06 Results · validation
What it showed, and what it cannot.
One run is not a result. It is a first look at whether a four-year-old can see a difference at all, and a list of what has to be measured before anyone says more. Every line below is marked: seen in the build, or still to test.
AFirst run, side by sidesame pump, same pipe, same time
A · pressed
B · loose
Status
Second layer
tamped hard
left as poured
Seen
The water
stays on the pressed layer
goes on down
Seen
Screens
66 / 96 / 23 % in layers 1–3
no probes yet
Seen
Tracer
not used on this side
red in every tray and the spill tray
Seen
For children
a wet band, a shining line
red moving down, water in a cup
To try
BReading the run from the photosside B, tray by tray · what can be seen, before any numbers
1 · Humus
Dark and wet; the dye is dripped in at the top.
2 · Soil
Red gathers along the floor of the tray.
3 · Sand
Red water stands on the sand before it drains.
4 · Small gravel
The pebbles are stained pink.
5 · Big gravel
Water passes; the stones stay mostly white.
Spill tray
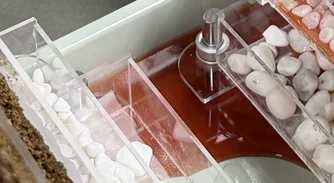
Red water collects and spreads out.
Water stood on the sand, even on side B. A fine layer over a coarse one can hold water without any tamping, so the next run has to tell the two causes apart.
Colour stays after the water leaves. The pink pebbles show where water passed, not where it is now – which is why colour is never used as a water level.
CHow the next run is measuredfive steps, the same on A and B
1 · Beforeone batch of soil; each layer weighed and measured; how A is tamped
2 · Rainthe same volume and rate on both, through one pipe, timed
3 · Watchthe first drip, where a water line forms, how long it stands
4 · Catchrunoff and drainage in separate cups, for A and for B
5 · Repeatthree runs for each case; exceptions are kept
DWhat the model cannot showkept on the teacher’s card as well
The profile is a teaching assumption, not a documented Auckland profile, until one is chosen to copy.
Fine soil over coarse grit can hold water by itself; interfaces are tested before pressing is blamed.
A darker band is wetness, not standing water; red is a tracer, not a nutrient, and it can stick to soil.
Pour minus catch is short-term retention, not water a plant can use.
A desk-sized model cannot be scaled up to predict a real garden’s drainage.
ENextin this order
1A real profileone documented Auckland soil to copy
2Small sampleseach interface tested on its own
3New A and Bremovable boxes, same geometry
4Three runsper case, measured as in C
5A classcards tried with a teacher
A garden stays when its water can leave.
The model’s whole argument in one line, for the children’s parents and for the next team that builds it.